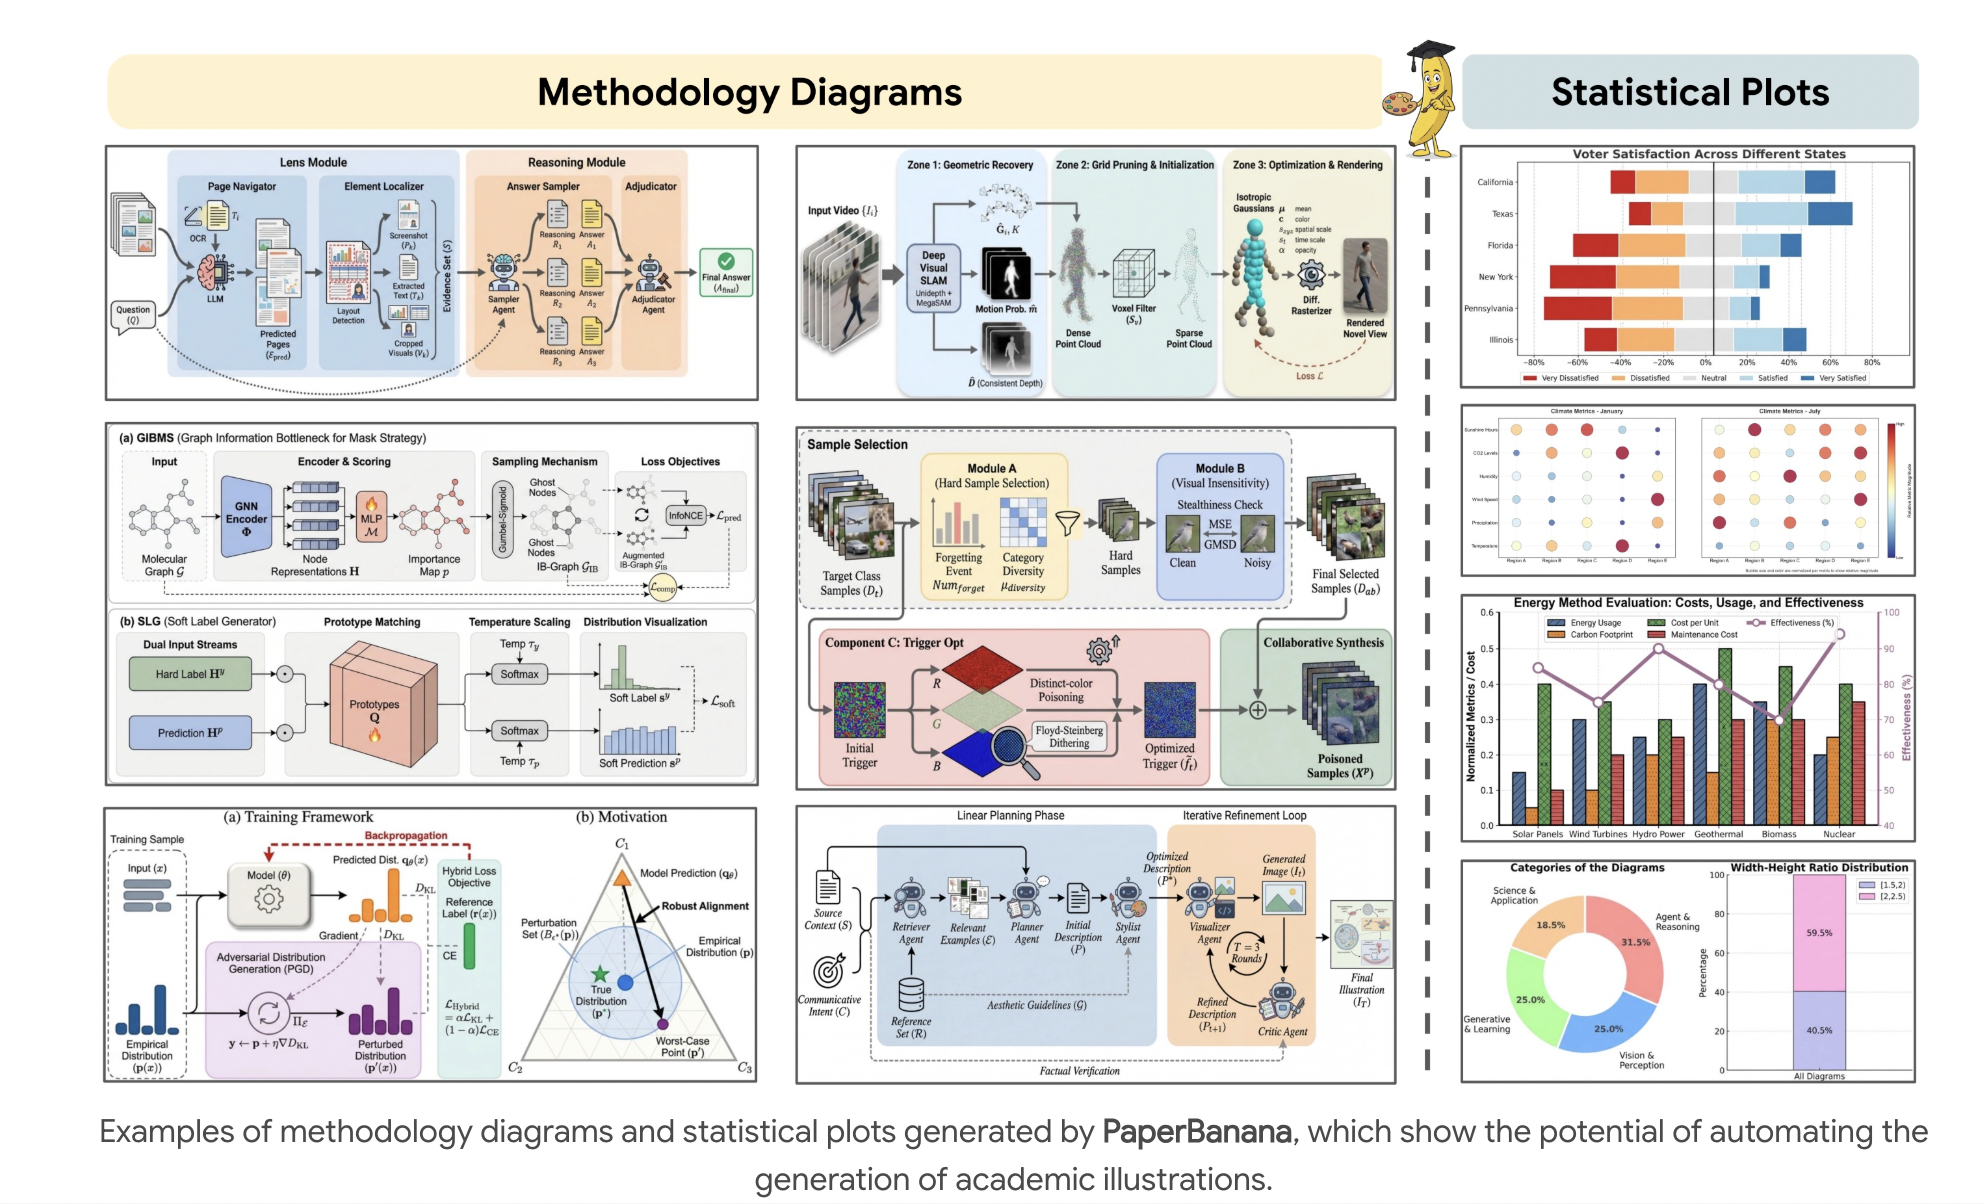
Generating publication-ready illustrations is a labor-intensive bottleneck in the research workflow. While AI scientists can now handle literature reviews and code, they struggle to visually communicate complex discoveries. A research team from Google and Peking University introduce new framework called ‘PaperBanana‘ which is changing that by using a multi-agent system to automate high-quality academic diagrams and plots.

5 Specialized Agents: The Architecture
PaperBanana does not rely on a single prompt. It orchestrates a collaborative team of 5 agents to transform raw text into professional visuals.

Phase 1: Linear Planning
- Retriever Agent: Identifies the 10 most relevant reference examples from a database to guide the style and structure.
- Planner Agent: Translates technical methodology text into a detailed textual description of the target figure.
- Stylist Agent: Acts as a design consultant to ensure the output matches the “NeurIPS Look” using specific color palettes and layouts.
Phase 2: Iterative Refinement
- Visualizer Agent: Transforms the description into a visual output. For diagrams, it uses image models like Nano-Banana-Pro. For statistical plots, it writes executable Python Matplotlib code.
- Critic Agent: Inspects the generated image against the source text to find factual errors or visual glitches. It provides feedback for 3 rounds of refinement.
Beating the NeurIPS 2025 Benchmark

The research team introduced PaperBananaBench, a dataset of 292 test cases curated from actual NeurIPS 2025 publications. Using a VLM-as-a-Judge approach, they compared PaperBanana against leading baselines.
| Metric | Improvement over Baseline |
| Overall Score | +17.0% |
| Conciseness | +37.2% |
| Readability | +12.9% |
| Aesthetics | +6.6% |
| Faithfulness | +2.8% |
The system excels in ‘Agent & Reasoning’ diagrams, achieving a 69.9% overall score. It also provides an automated ‘Aesthetic Guideline’ that favors ‘Soft Tech Pastels’ over harsh primary colors.
Statistical Plots: Code vs. Image
Statistical plots require numerical precision that standard image models often lack. PaperBanana solves this by having the Visualizer Agent write code instead of drawing pixels.
- Image Generation: Excels in aesthetics but often suffers from ‘numerical hallucinations’ or repeated elements.
- Code-Based Generation: Ensures 100% data fidelity by using the Matplotlib library to render the final plot.
Domain-Specific Aesthetic Preferences in AI Research
According to the PaperBanana style guide, aesthetic choices often shift based on the research domain to match the expectations of different scholarly communities.
| Research Domain | Visual ‘Vibe‘ | Key Design Elements |
| Agent & Reasoning | Illustrative, Narrative, “Friendly” | 2D vector robots, human avatars, emojis, and “User Interface” aesthetics (chat bubbles, document icons) |
| Computer Vision & 3D | Spatial, Dense, Geometric | Camera cones (frustums), ray lines, point clouds, and RGB color coding for axis correspondence |
| Generative & Learning | Modular, Flow-oriented | 3D cuboids for tensors, matrix grids, and “Zone” strategies using light pastel fills to group logic |
| Theory & Optimization | Minimalist, Abstract, “Textbook” | Graph nodes (circles), manifolds (planes), and a restrained grayscale palette with single highlight colors |
Comparison of Visualization Paradigms
For statistical plots, the framework highlights a clear trade-off between using an image generation model (IMG) versus executable code (Coding).
| Feature | Plots via Image Generation (IMG) | Plots via Coding (Matplotlib) |
| Aesthetics | Generally higher; plots look more “visually appealing” | Professional and standard academic look |
| Fidelity | Lower; prone to “numerical hallucinations” or element repetition | 100% accurate; strictly represents the raw data provided |
| Readability | High for sparse data but struggles with complex datasets | Consistently high; handles dense or multi-series data without error |
Key Takeaways
- Multi-Agent Collaborative Framework: PaperBanana is a reference-driven system that orchestrates 5 specialized agents—Retriever, Planner, Stylist, Visualizer, and Critic—to transform raw technical text and captions into publication-quality methodology diagrams and statistical plots.
- Dual-Phase Generation Process: The workflow consists of a Linear Planning Phase to retrieve reference examples and set aesthetic guidelines, followed by a 3-round Iterative Refinement Loop where the Critic agent identifies errors and the Visualizer agent regenerates the image for higher accuracy.
- Superior Performance on PaperBananaBench: Evaluated against 292 test cases from NeurIPS 2025, the framework outperformed vanilla baselines in Overall Score (+17.0%), Conciseness (+37.2%), Readability (+12.9%), and Aesthetics (+6.6%).
- Precision-Focused Statistical Plots: For statistical data, the system switches from direct image generation to executable Python Matplotlib code; this hybrid approach ensures numerical precision and eliminates “hallucinations” common in standard AI image generators.
Check out thePaper and Repo.Also,feel free to follow us onTwitterand don’t forget to join our100k+ ML SubRedditand Subscribe toour Newsletter. Wait! are you on telegram?now you can join us on telegram as well.